AgriSense-AI
An end-to-end IoT system
- Role
- Sistem Mimarı
- Period
- 2026-03 – 2026-04
- Team
- 2
An end-to-end IoT system for soil nutrient analysis and plant health monitoring, integrated with LoRaWAN connectivity and LLM-powered expert insights for precision agriculture.
Problem
In agriculture, soil imbalance is almost always noticed too late — after the plant already shows visible stress. By that point the damage is done and the intervention is more expensive and less effective. Four values decide whether a root zone is healthy: moisture, temperature, pH and electrical conductivity (EC), and all four move together. Watering fixes moisture but dilutes EC; a pH drift blocks nutrient uptake even when EC looks perfect.
Existing options each fail in a different way. Manual measurement is a snapshot: someone has to walk to the field, and nobody does that every hour. Laboratory analysis is accurate but takes days. Commercial telemetry systems are expensive and typically require cellular coverage and a subscription for every single node — unrealistic for a field that has neither mains power nor reliable signal.
There is also a second, less obvious problem: even when the data exists, it is not actionable. A reading of "EC 1450 µS/cm, pH 6.2, humidity 38%" means nothing to a grower who is not a soil scientist. The gap is not only measurement, it is interpretation.
So the system had to solve three things at once: measure continuously and automatically, transport the data over long distance with low power and without per-node internet, and turn raw numbers into a plain-language recommendation.
Solution & architecture
The system is an end-to-end pipeline built from four layers, each with a single responsibility.
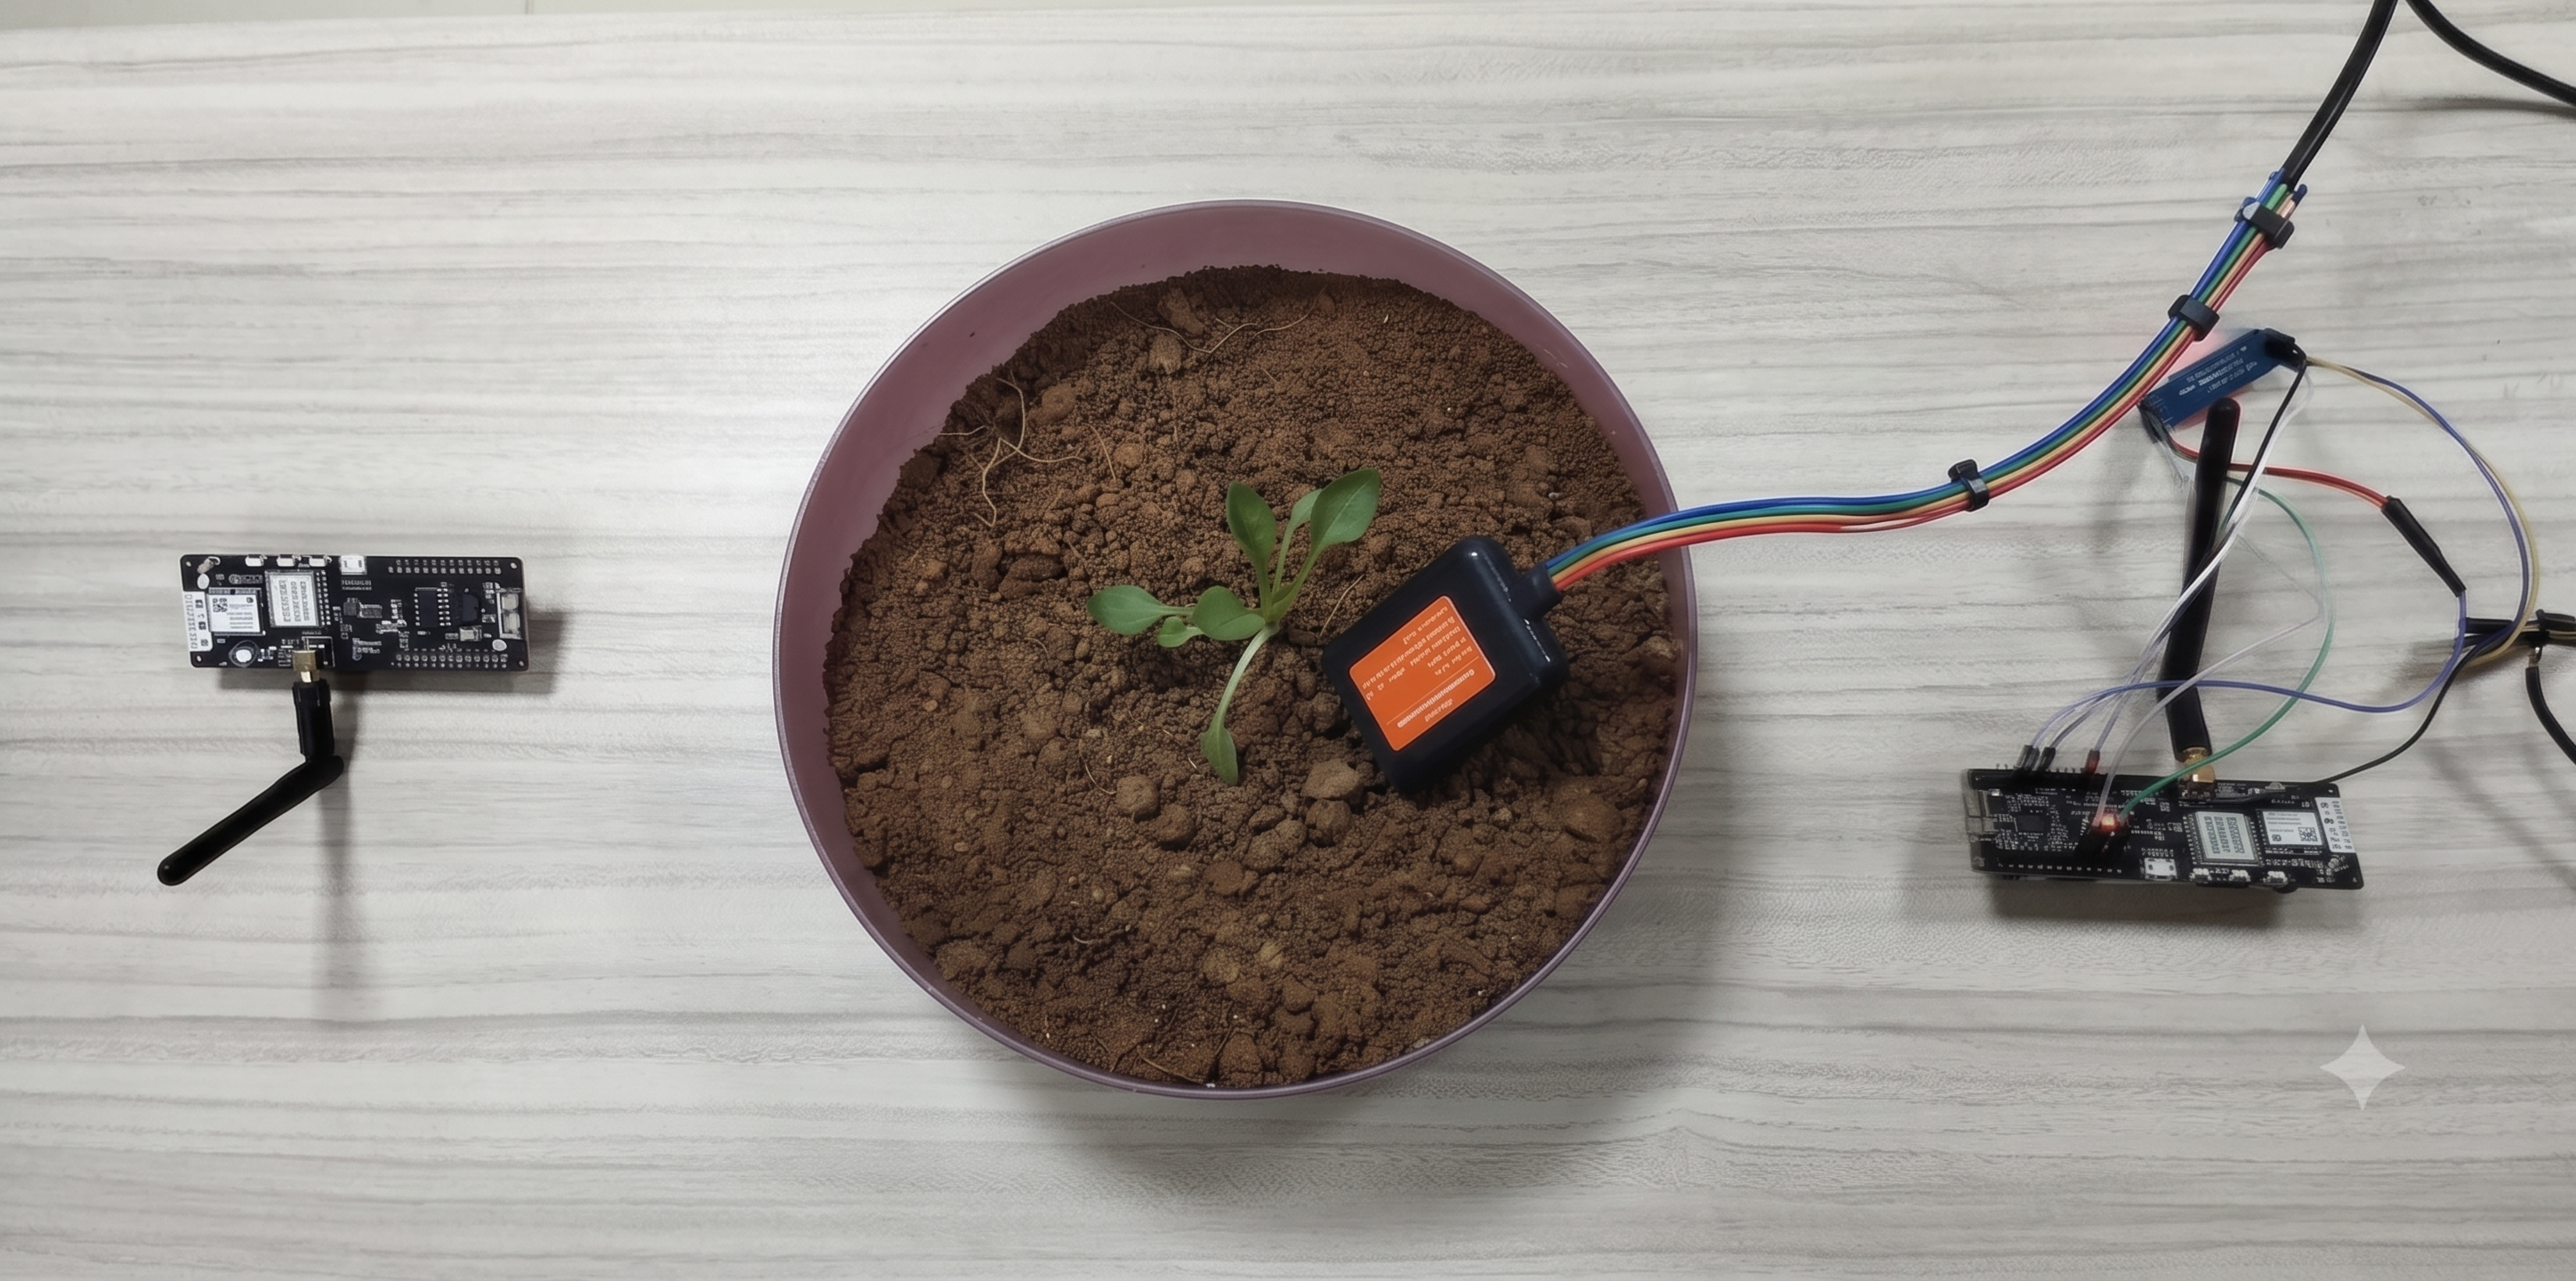
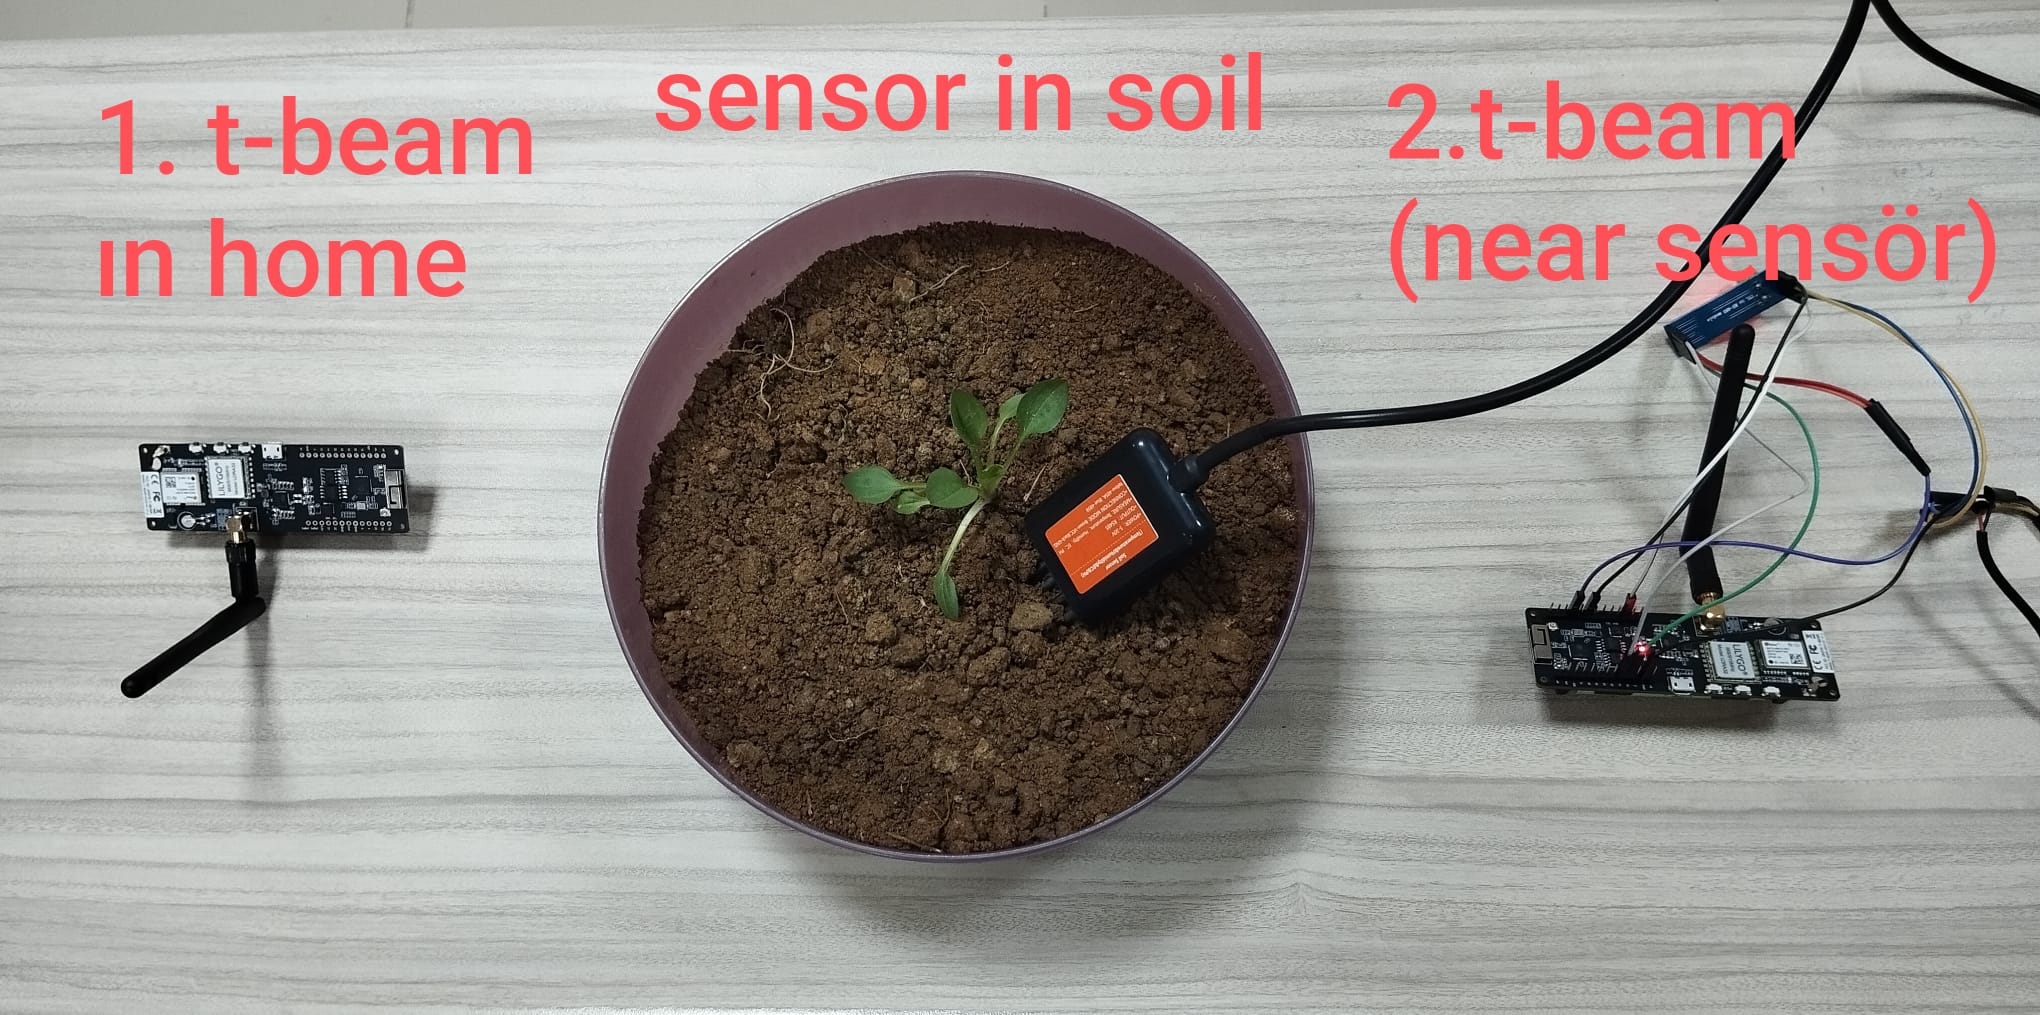
Sensor node (field). An IP68 4-in-1 soil probe is read over RS485 / Modbus RTU by a LilyGO T-Beam (ESP32 + SX1276). The firmware is ESP-IDF with the Arduino component, so it keeps setup() / loop() while still building under idf.py. A MAX485 converter sits between the probe and the ESP32: UART1 on GPIO 13/14, with GPIO 4 driving the DE/RE direction pin through the ModbusMaster preTransmission / postTransmission callbacks. Every 60 seconds the node reads four holding registers starting at 0x0000 and scales them into humidity, temperature, EC and pH. If a read fails, the packet is simply not sent — bad data never enters the pipeline.
LoRa link. The reading is packed into a deliberately compact JSON payload ({"h":..,"t":..,"ec":..,"ph":..}) and transmitted at 868 MHz (EU band), SF9, 125 kHz bandwidth, sync word 0x12, with CRC enabled. Short keys matter here: the LoRa frame limit is 255 bytes, and every byte costs airtime and power.
Gateway. A second T-Beam listens permanently. The receive callback runs in interrupt context, so it only copies bytes into a buffer and raises a flag; the actual HTTP work happens back in loop() under a guarded copy. The gateway holds WiFi with auto-reconnect and forwards each packet as an HTTPS POST /api/readings with an x-api-key header. Credentials never live in the repository: tools/gen_secrets_h.py reads gateway/.env at build time and generates secrets.h.
Backend and AI. Node.js + Express + Prisma + PostgreSQL, with two tables — readings and alerts (cascade-linked). Writes are authenticated by API key; reads are open to the panel through a CORS allowlist. On every reading the analysis service sends the four values to an LLM (Groq first, OpenAI as fallback) with a strict JSON contract: hasAlert, severity, message. The response is mapped to the storage vocabulary (high → critical, medium → warning, low → info). Critically, the LLM is treated as optional: if the key is missing, the API errors, or the response is not valid JSON, the service returns null and a deterministic rule check still raises an alert for physically extreme values (pH < 4.5 or > 8.5, temperature < 5 or > 42 °C, EC < 50 or > 5000). The system degrades, it does not go blind.
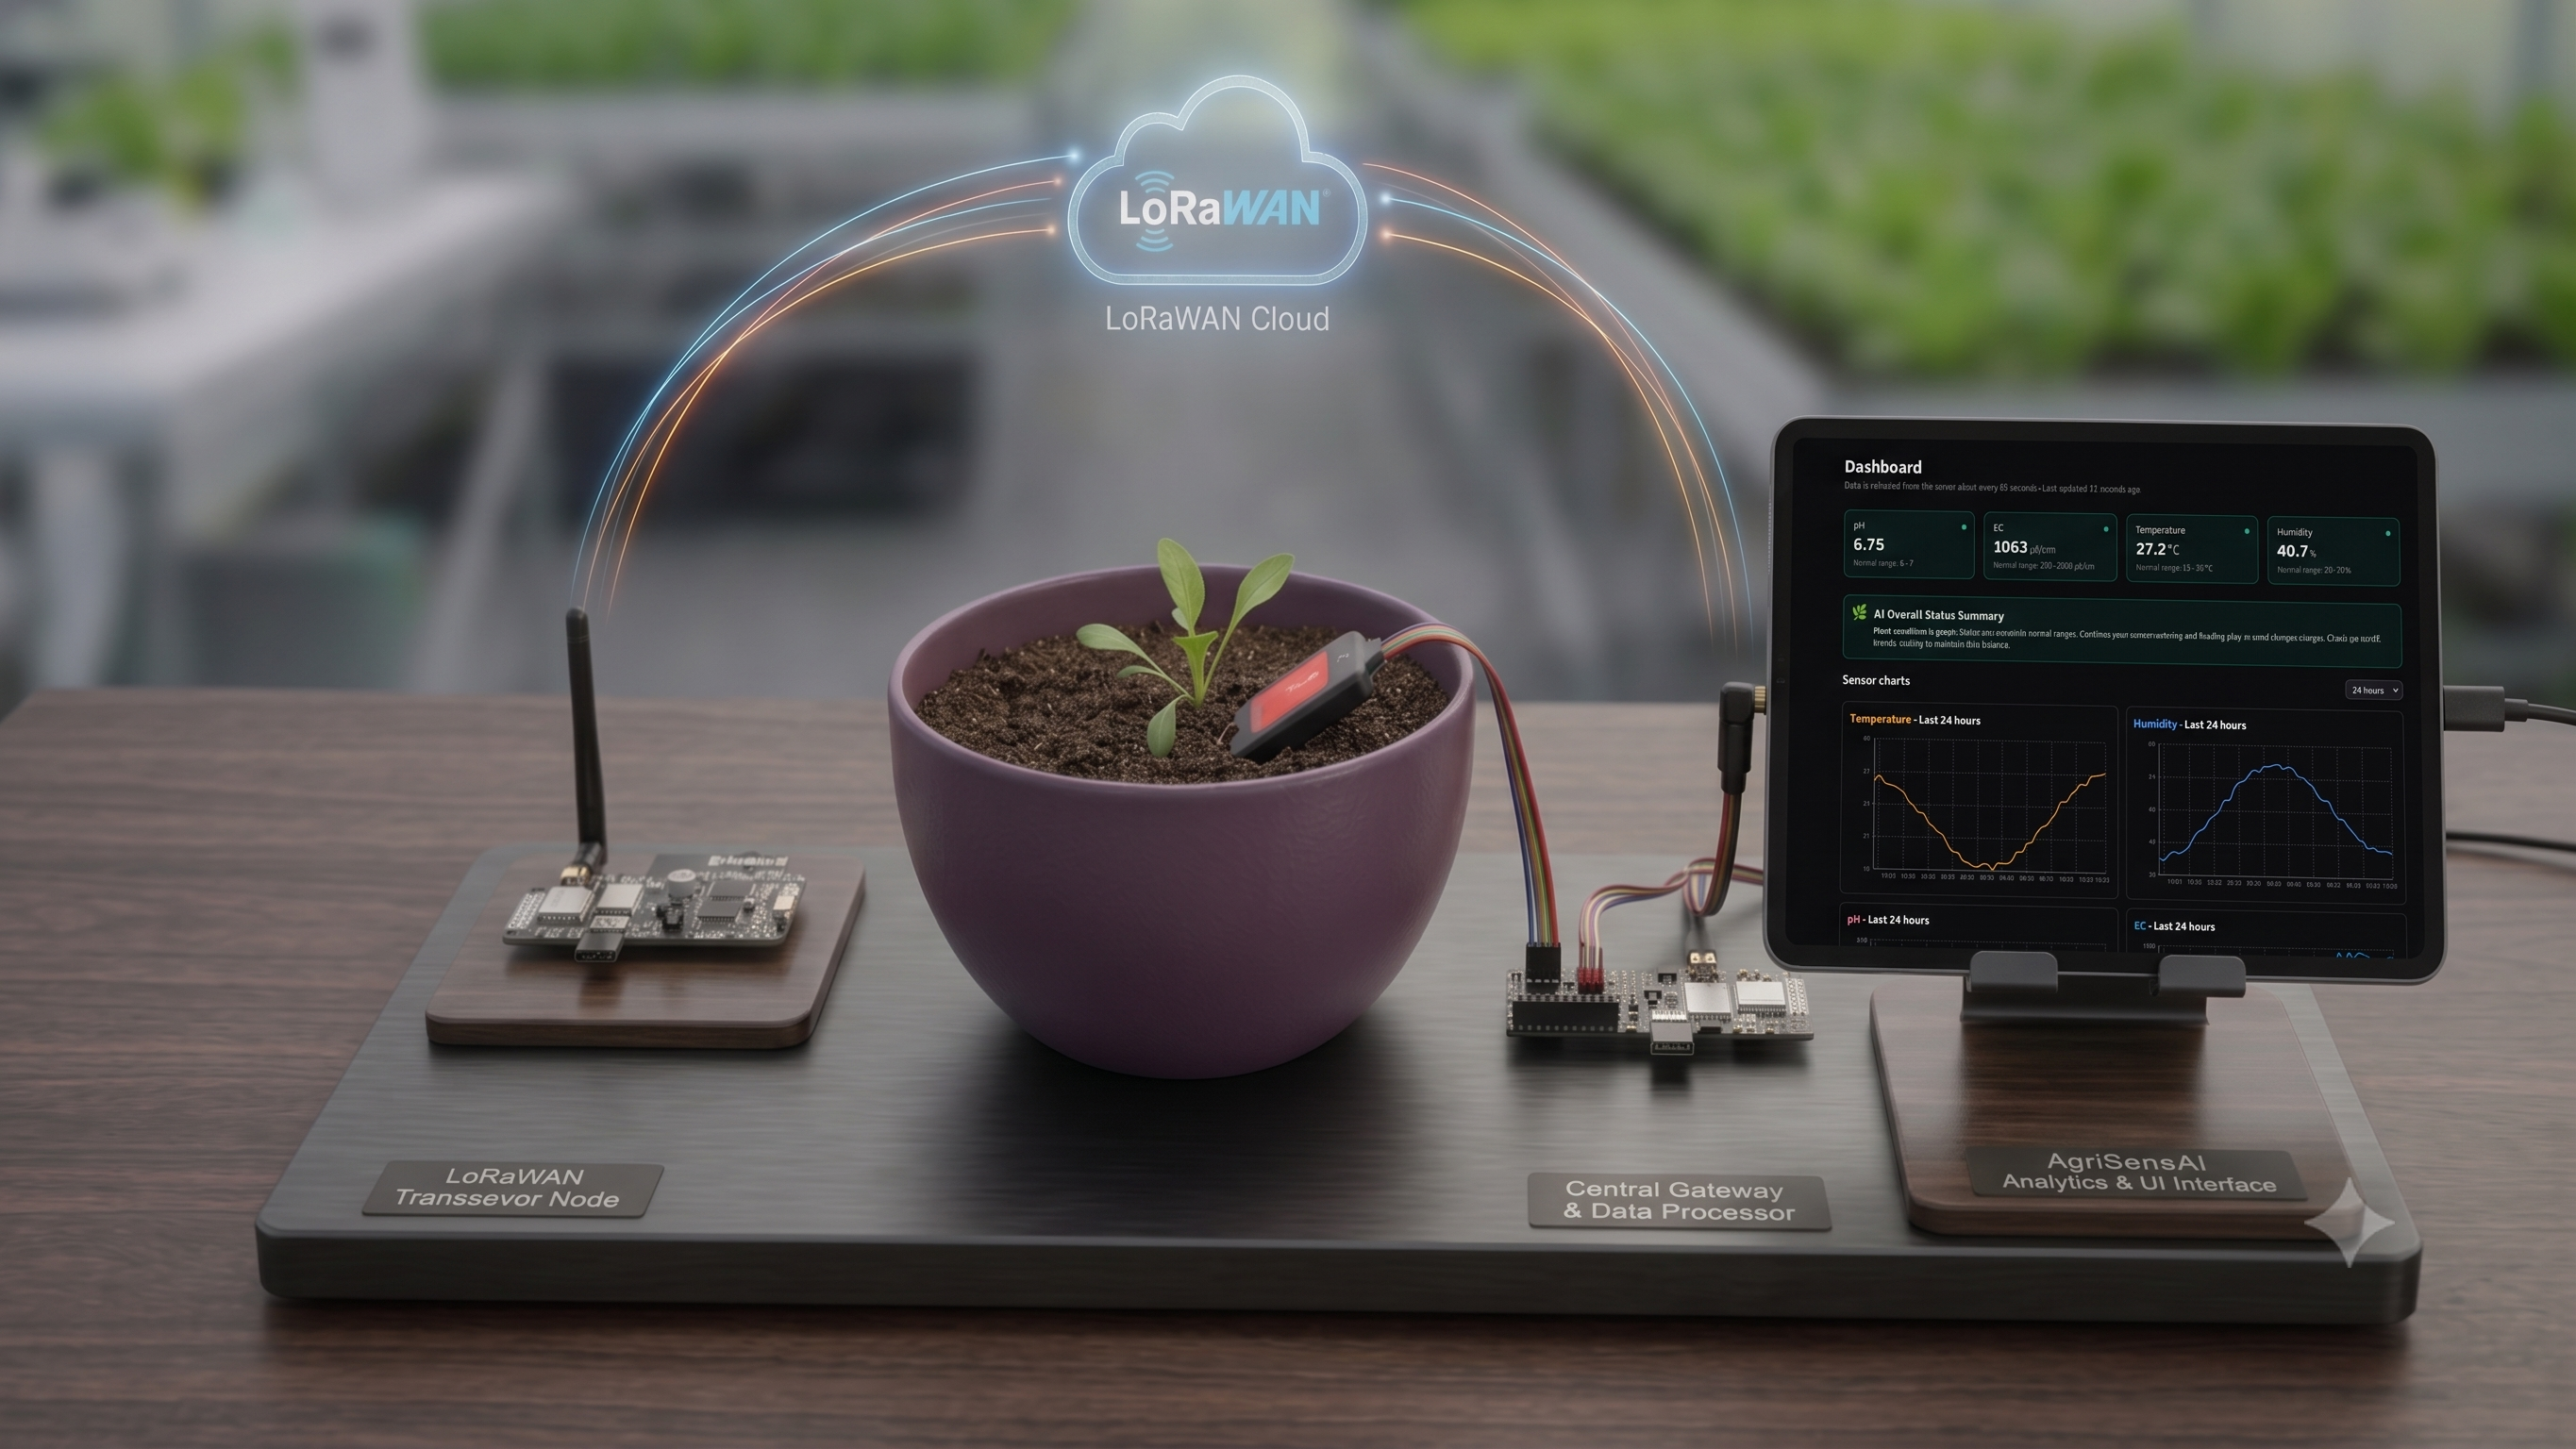
Web panel. A Next.js (App Router) dashboard in TypeScript and Tailwind: four value cards colour-coded against agronomic thresholds (pH 6–7, EC 200–2000 µS/cm, 15–30 °C, 20–70 % humidity), four Recharts trend charts with 24-hour / 1-week / 1-month ranges, an AI status summary card, and a severity-filtered alert list. Data refreshes every 60 seconds, matching the sensor interval.
flowchart TD
    subgraph FIELD["Field / Tarla"]
        S["4-in-1 Soil Sensor<br/>pH · EC · Humidity · Temperature<br/>IP68"]
        M["MAX485 Converter<br/>RS485 to UART TTL"]
        N["T-Beam 1 — Sensor Node<br/>ESP32 + SX1276<br/>ESP-IDF + Arduino component"]
    end

    subgraph LINK["Long Range Link / Uzun Menzil"]
        G["T-Beam 2 — Gateway<br/>LoRa RX + WiFi STA<br/>ISR buffer, POST in loop"]
    end

    subgraph SERVER["Backend / Sunucu"]
        API["Express API<br/>POST /api/readings<br/>GET /api/readings, /latest, /alerts"]
        DB[("PostgreSQL + Prisma<br/>readings · alerts")]
        LLM["LLM Analysis Service<br/>Groq primary, OpenAI fallback"]
        RULE["Rule-based Fallback<br/>extreme value check"]
    end

    subgraph PANEL["Web Panel"]
        UI["Next.js Dashboard<br/>cards · charts · alerts<br/>60 s auto refresh"]
    end

    S -->|"Modbus RTU · 9600 8N1 · slave 1"| M
    M -->|"UART1 GPIO 13/14 · DE-RE GPIO 4"| N
    N -->|"LoRa 868 MHz · SF9 · BW 125 kHz · sync 0x12 · CRC"| G
    G -->|"HTTPS POST · x-api-key · JSON h,t,ec,ph"| API
    API -->|"persist reading"| DB
    API -->|"4 values"| LLM
    LLM -->|"hasAlert · severity · message"| API
    LLM -.->|"key missing, API error or bad JSON"| RULE
    RULE -->|"warning alert"| DB
    API -->|"store alert"| DB
    UI -->|"GET every 60 s"| API
    API -->|"readings + alerts + AI summary"| UI
Live demo
Outcome
The pipeline works end to end: a value measured in the soil appears on the web dashboard, interpreted, within roughly one measurement cycle. Concretely, the finished system delivers a field node that reads four soil parameters every 60 seconds over Modbus RTU, a point-to-point LoRa link at 868 MHz that needs no cellular subscription and no internet at the sensor itself, a gateway that survives WiFi dropouts and keeps listening, a REST API with four endpoints backed by PostgreSQL, an LLM layer that converts four numbers into a two-sentence recommendation, and a dashboard that answers "is it healthy right now, and what should I do next" on a single screen.
Two design decisions turned out to matter more than anything else. The first is that the AI layer is optional rather than load-bearing: alerting keeps working when the LLM key, network or quota is gone, which is what makes the system honest enough to leave running. The second is layer isolation — because the gateway speaks plain HTTP JSON, the entire server side could be developed and tested against a webhook endpoint long before the radio link was reliable, and the panel could be developed against the API without touching hardware at all.
Known limitations, stated plainly. The LoRa link is point-to-point, not a full LoRaWAN network server, so it has no OTAA join, no per-device session keys and no multi-node addressing; RF packets are unauthenticated and a matching sync word is the only filter. The backend caps history queries at 200 rows, so the 30-day chart is coarser than the 24-hour one. The LLM is called on every latest-reading request, which costs money and latency — a threshold pre-filter (only call when a value leaves its normal band) is the obvious next step. Battery and solar behaviour has not been validated over a long field deployment.
Next steps: threshold-gated LLM calls with response caching, mobile/push notification on critical alerts, a proper LoRaWAN stack with device authentication, multi-node support with device IDs in the payload, and additional sensor types.